Debugging
There are a number of ways to debug firmware on a µC:
- With hardware, e.g. blink LEDs, an attached display, or a Logic Analyser.
- With software, i.e. a serial console of some kind and print statements.
- With a debugger, i.e. running an application with
gdbusing breakpoints and watchpoints. - With a trace probe, e.g. Segger's J-Trace products. This is expensive and (well) out of reach for most hobbyist.
Hardware
Option 1) with an on-board LED is by far the simplest: just turn the LED on and off to "report" some state changes in the application. Sometimes it's all you need to figure out where the code hangs or crashes. Simple blink patterns can convey a bit more information, but obviously only up to a point.
With an attached display, even just a few 7-segment LEDs, more information can be shown, but things may disappear too quickly to really figure what sequence of events just occurred. A text or graphics LCD might help a bit, but they can also interfere with the rest of the application in different ways.
As non-intrusive tool, a logic analyzer is a great alternative to an oscilloscope for digital signals, with far more storage, protocol decoders, and timing information, but this level of detail can also end up being overwhelming. The problem is now about finding the needle in the haystack ... This simple unit from WeAct is a nice low-cost option for up to 8 signals.
Software
The most common approach for development is logging: sprinkle some sort of print statement across the entire application to send out messages and report current values. There are many ways to do this, but they all need a way to get the text from the target µC to the development host system.
Again: there are several ways to do this, such as UART, SWO, or RTT.
UART
The obvious way to send messages is via a serial port: a UART with a TX pin, attached to the hardware debugger's RX pin. This JeeH example uses USART1, with TX connected to pin A9 on STM32F103:
constexpr uart::Config UART_CONF {
    "A9:7", USART1.ADDR, ena::USART1, false, 72,
};
uart::Poll<UART_CONF> console;

extern "C" int _write (int, char* buf, int len) {
    return console.write(buf, len);
}

int main () {
    ...
    console.init(115'200);
    ...
}
Then in the application, use logf("sum = %d", 1+2);
(or printf("sum = %d\n", 1+2);).
This works, but there are drawbacks: the baudrate between target & host must match, and sending messages takes time, during which the app is held up. The baudrate could be raised to 921,600 or even 2,000,000 Baud to alleviate the problem, but each printf/logf call is still briefly blocking. If the baudrate depends on the system clock, then clock changes also need extra care. Each of these issues could be problematic in some debugging scenarios.
SWO
Another mechanism is SWO, which is part of the debug hardware built into most ARM Cortex µC's (except, unfortunately, Cortex M0+). This is slightly less intrusive on the target side than a UART because there is some buffering: up to a point, (small) messages sent at not too high a rate will not hold up the rest of the application.
SWO is uni-directional and uses a specific GPIO pin on the µC (usually PB3 for STM32), which needs to available. Also, as with UART debugging, SWO has to be set up to use a specific baudrate (tied to the system clock speed).
The data sent over the wire is slightly different for SWO, because it supports multiple "channels". Channel 1 is usually for logging. Channels can be enabled / disabled as needed in the debugger to control the amount of information being sent. Some very simple decoding is needed to split incoming channels, but this also means that a serial terminal emulator is not perfect for this task. The Black Magic Probe (see uploading) has a command to set the baud rate and enable the decoder.
As with the UART, the problem of matching baudrates remains, but since there is some buffering on the target side, SWO can be slightly more flexible for debugging than a UART port.
The following code will enable SWO in a JeeH application:
void jeeh::logWriter (const void* ptr, size_t len) {
    swoWrite(ptr, len);
}

int main () {
    ...
    swoInit(115'200);
    ...
}
This does not alter the printf setup, only logf will be routed over SWO,
channel 1: logf("sum = %d", 1+2);.
On the BMP, some commands need to be given in gdb to enable SWO and set up the
baudrate, see BMP's page.
Once SWO is connected, log
output appears on BMP's serial port, viewable via a terminal (or
PIO's built-in one: pio device monitor).
When SWO is not connected or channel 1 is disabled, all log output is dropped.
With proper setup (extra wire + BMP config) and assuming its flaws are acceptable, SWO is a valid debuging mechanism. Note that on Cortex M0+, SWO can be emulated with a UART by inserting a 0x01 byte in front of each character sent.
RTT
Real Time Transfer is a protocol by Segger which uses another approach: the application saves its messages in a buffer and the hardware debugger continuously extracts that data over SWD. It also works in the other direction: data from the debugger can be placed in a (different) buffer for the app to treat as incoming requests. RTT was created for use in JLink.
The trick is that the buffer area is marked with a special header which the debugger will look for by scanning through RAM.
There are several implications with this approach:
- some buffer space needs to be reserved in RAM for log information (default 1 KB for for TX and 32 b for RX)
- all data is transferred over SWD, using the same pins as when uploading or debugging from gdb
- in other words: there are no extra pins / wires or baudrates to deal with
- performance is surprisingly good - this will obviously depend on SWD's clock rate
- RTT will start working as soon as the µC comes out of reset, even before
mainstarts running - it works on all Cortex models (with some code taking care of flushing hardware caches on M7)
- Segger's RTT protocol is fully documented and now also implemented in the BMP software
What's there not to like about this? Only very minor details: 1) the additional buffer space, which might prevent its use in highly RAM-constrained devices, 2) the BMP needs to enable RTT, and 3) logging might block when RTT is not being read.
The following code will enable RTT support for JeeH's logf and log in
non-blocking mode:
rtt::Desc rttDesc;

void jeeh::logWriter (const void* ptr, size_t len) {
    rttDesc.tx.write((const char*) ptr, len);
}
The above rttDesc declaration defines two static buffers (to increase the TX
buffer, use rtt::Desc<4096>). Note that this is not interrupt-safe: to
reliably log from different JeeH tasks without locking, a rewrite based on
multiple buffers is required.
Debug examples
Here is an example configuration which supports all three debug logging modes: UART, SWO, and RTT. On the left is a BMP running on an F411 "BlackPill", on the right is a G474 target board:
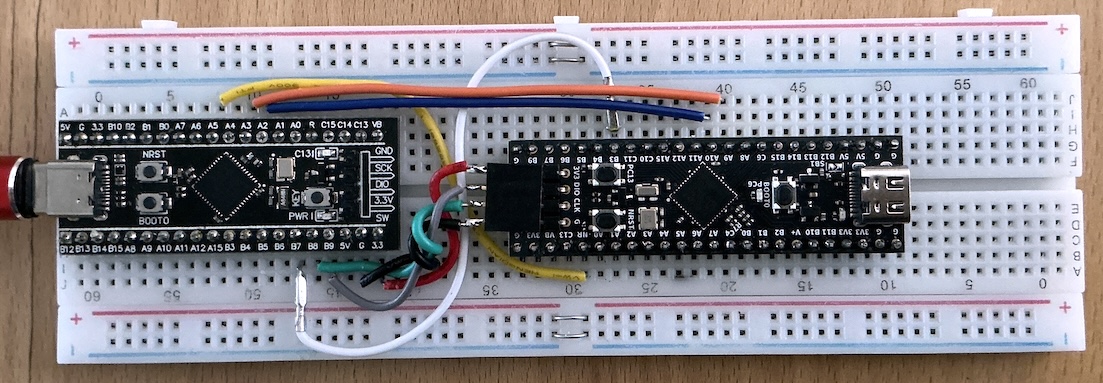
There are 8 wires: POWER (red + black), SWD (green + gray), RESET (yellow),
UART (orange + blue), and SWO (white).
Only 4 wires (POWER and SWD) are needed for a minimal setup:
this will support uploading, RTT logging, and gdb debug.
Debugger
See this page for details about
using gdb from PatformIO in combination with the Black Magic Probe.